
Gas Prices, the Summer of 2018, and You
A snapshot of this year’s trends.
 Certain subjects tend to surface when conversation lulls. Bringing up the weather is perhaps the most classic example, but don’t undersell the subject of gas prices as an discussion igniter. Everyone’s interested in the topic, because everyone is affected, which means everyone has an opinion. It’s an odd unifier, but talk about gas prices does bring people together.
Travelers to different parts of the U.S. know how widely the cost of fuel varies from state to state, county to county, and even locality to locality. While there are many resources that can help you stay up to date on current petroleum pricing around the world (we wrote about the granular approach of the most prominent in this blog post, but today SSCS is taking its own look at gas prices, and in the process, providing its own little snapshot of what fuel costs and how much that really matters.
Let’s start by getting an idea of how much variation really exists (click on the image below for a larger view):
 An average driver in Hawaii pays about $576 more each year on gasoline than one in Mississippi. In 2018 the two states find themselves at the opposite ends of the spectrum, with Hawaiian drivers paying $124 more dollars a year in state gas taxes alone. State gas taxes, however, only go so far in determining the difference between gas prices between states. Hawaii’s remoteness and generally high cost of living frequently put it at or near the top of the list in terms of expensive fuel costs. Conversely, Mississippi’s centrality in the South, and its lower cost of living mean that drivers there expect to pay less at the pump, and statistically tend to do so. Many factors go into determining fuel costs. The US Energy Information Administration breaks down fuel cost per gallon as follows.
| Gasoline | Diesel | |
| Refining Costs | 12% | 14% |
| Distribution/Marketing | 12% | 17% |
| Federal/State Taxes | 15% | 19% |
| Crude Oil Prices | 61% | 50% |
You can see that there’s no single factor that drives gas prices from state to state. Generally speaking, the West Coast and Hawaii tend to be the most expensive states to drive in, but when we look at the numbers systematically we see that geography can drive gas prices up just as much as state tax regulation:
Gas Price by State, Summer of 2018 (Source: AAA)
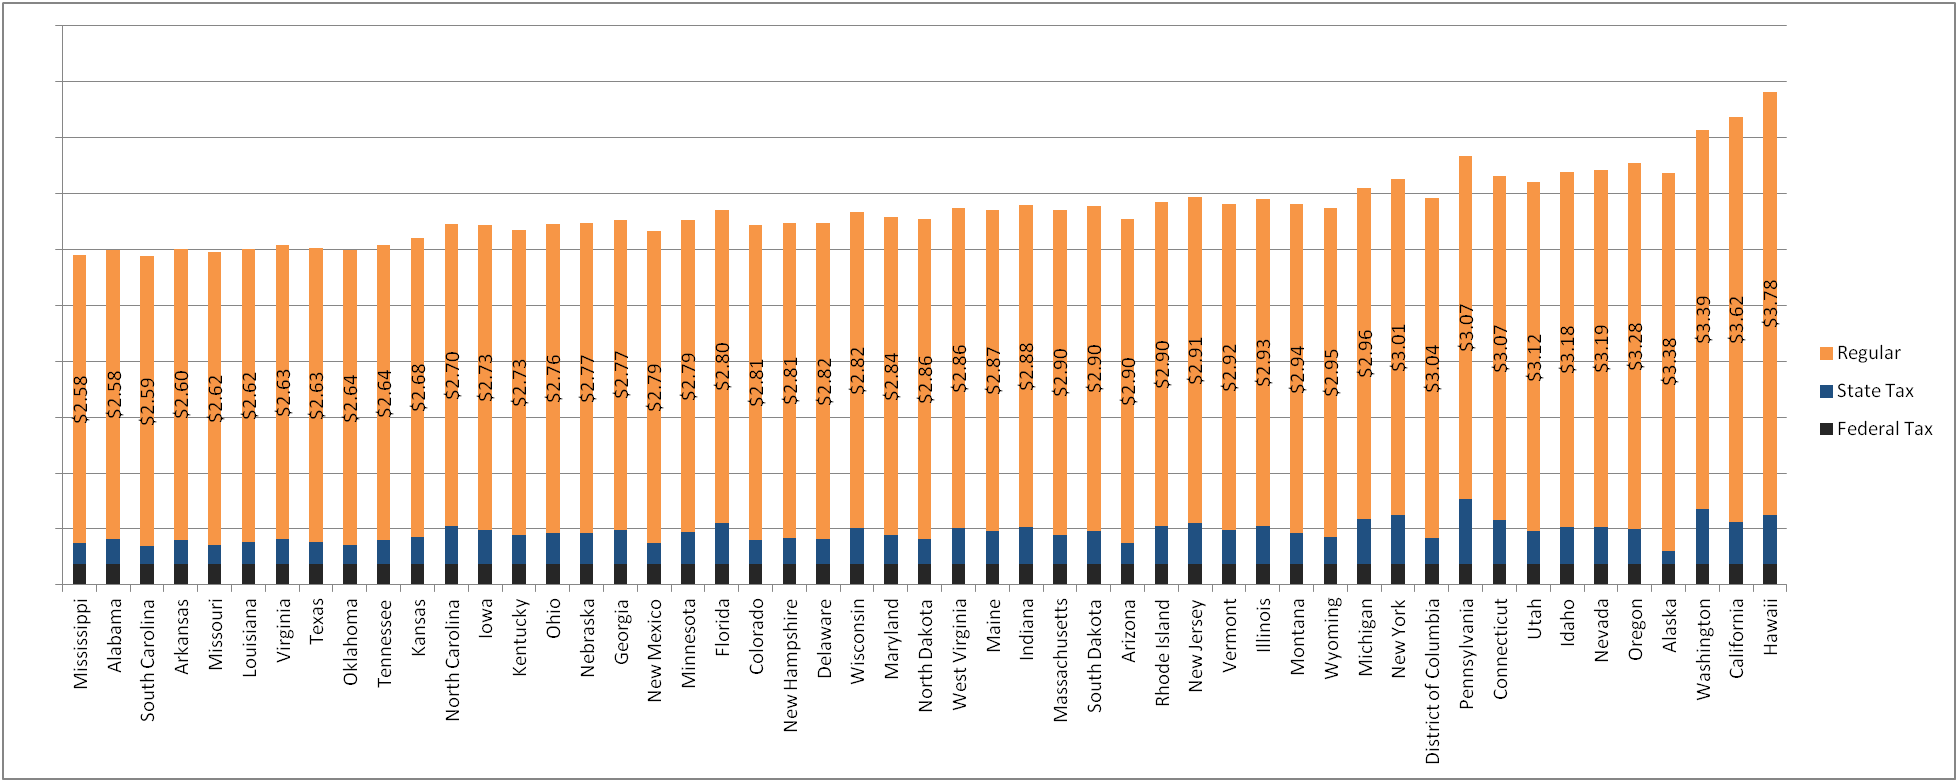 The above graphic (click on it and subsequent images to enlarge them) provides a look at the complex interplay between federal excise tax ($0.184 nationwide), state gas tax (which ranges from $0.1225 in Alaska to $0.582 in Pennsylvania), and other factors like transportation costs. Notice that Alaska’s bottom-of-the-barrel state gas tax can’t keep it from having the fourth highest price per gallon in the nation, due to the sheer remoteness of the state.
Gas State Tax per Gallon (Source: Tax Foundation)
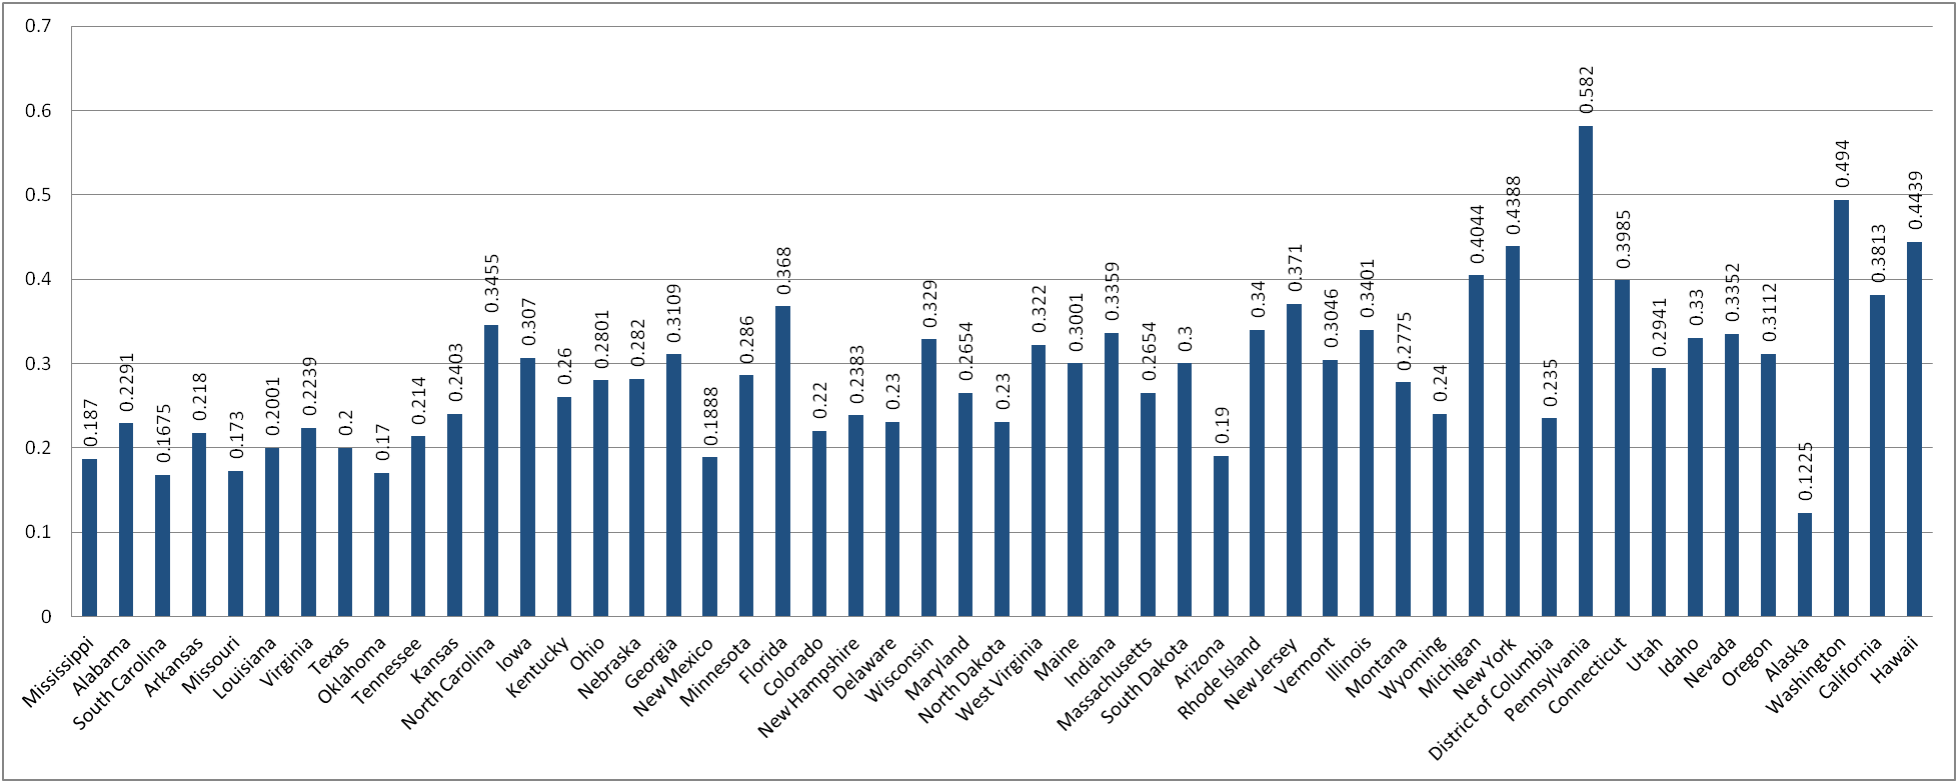 This above chart shows the wide range of state taxes Americans pay when they purchase gasoline. Predictably, the states where it’s cheapest to buy gas often have low state gas taxes, but there are some interesting bumps in the distribution. States like Wyoming, North Dakota, Arizona, and Montana have very low state gas taxes, but the cost of transporting fuel in these states is such that low taxes can’t protect drivers from above-average fuel prices. Conversely, Pennsylvania, parked in the middle of a region where gas stations are close together and fuel transportation costs are low, drives its gas prices up by having the highest state gas taxes in the U.S.
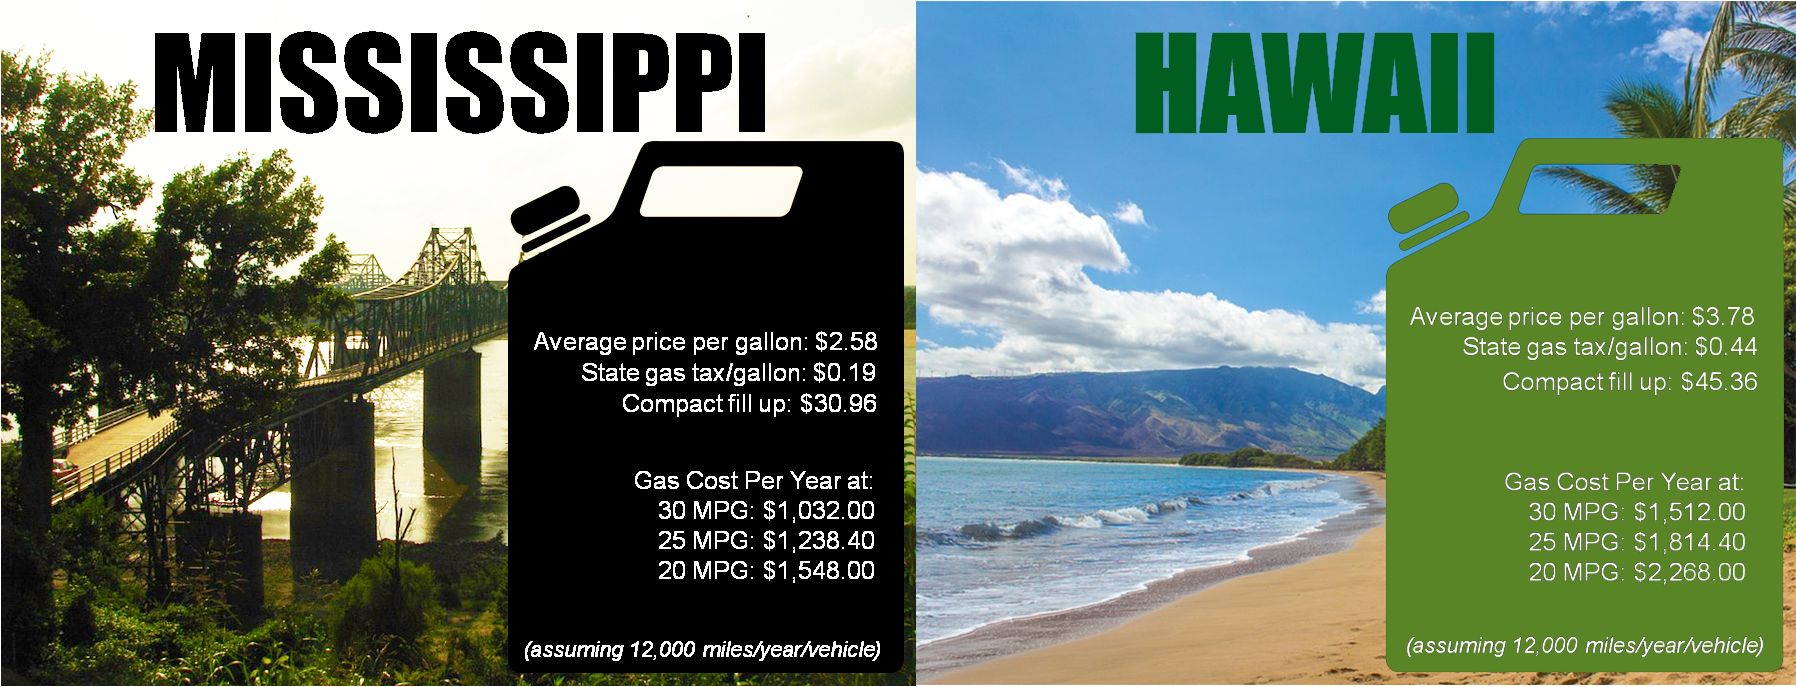
Filling Up a Compact Car by State (Based on Information from AAA)
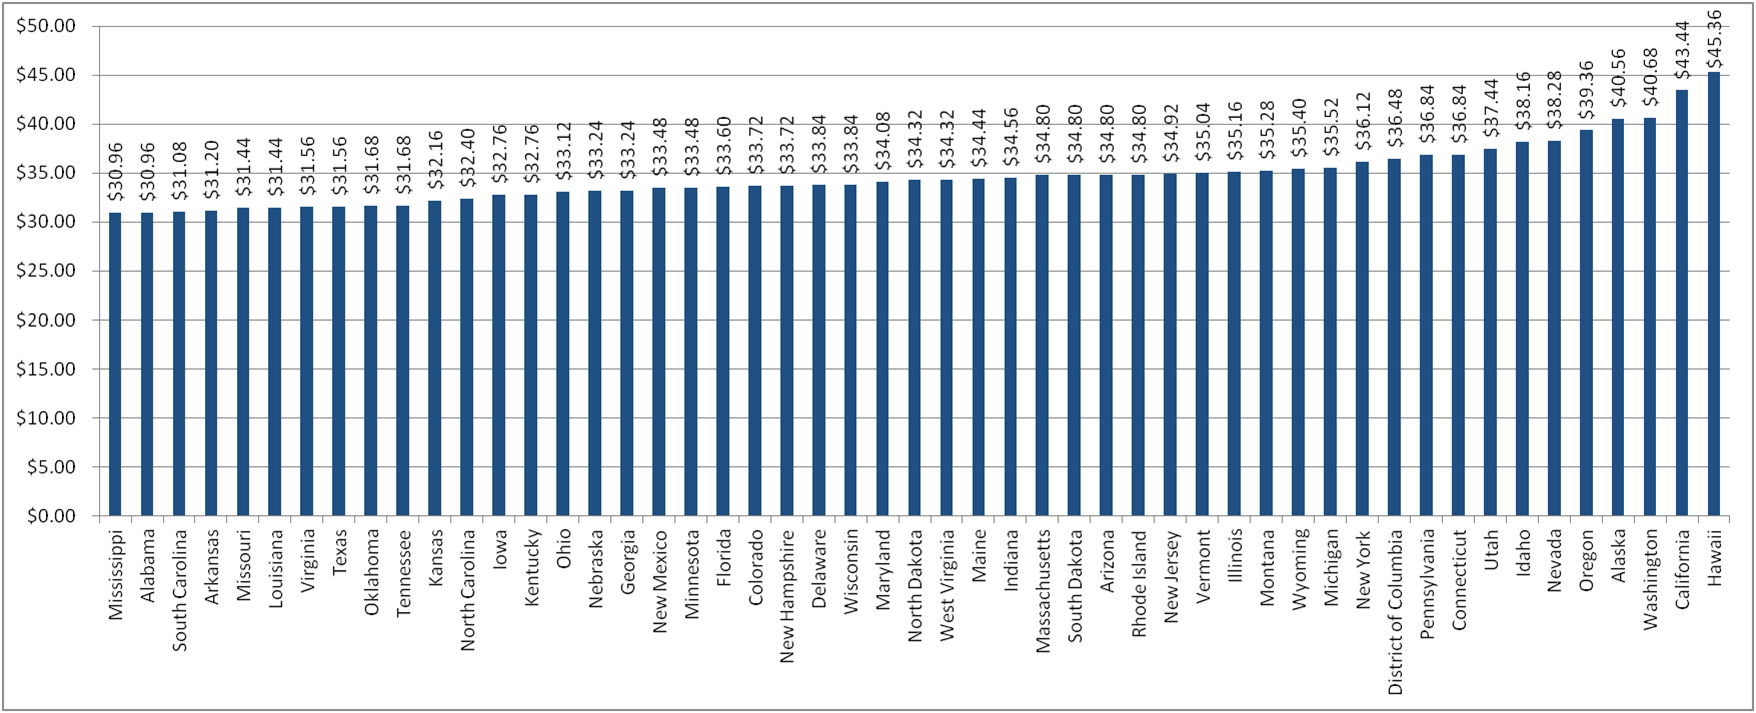 We almost never buy single gallons of gasoline, so it’s helpful to picture how these prices affect weekly gas purchases. Assuming a compact car has a tank size of 12 gallons, which is a widely accepted national average, the costs of filling up can vary significantly from state to state. In Hawaii, such a fill up sets you back $45.36, $14.40 more than Mississippi’s considerably cheaper $30.96.
Annual riving Costs with this Summer’s Prices (Based on Information from AAA)
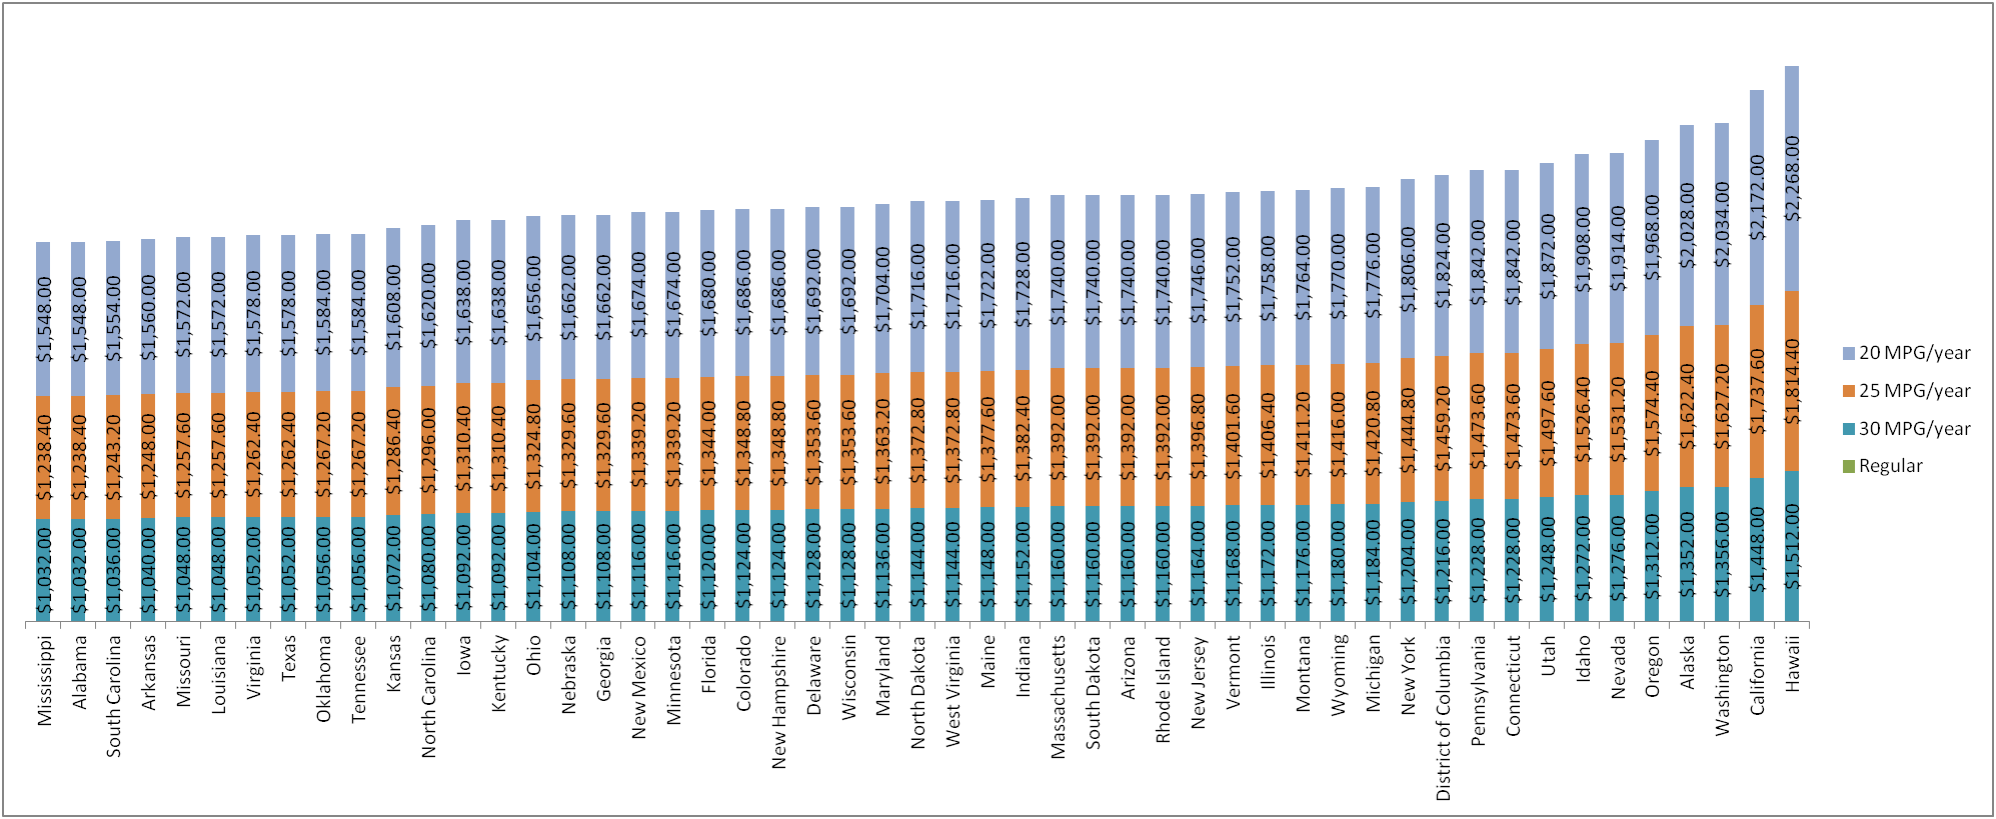 Perhaps the most compelling factor to consider is how these slight differences in fuel prices play out over the course of a year. Assuming that the average driver covers about 3,000 miles per year on the road, we can see some pretty divergent statistics on how much Americans from different regions of the country spend on fuel. As we saw toward the beginning of this blog post, Hawaiians not only have to pay more for rent and food—they also shell out around $576 more every year on gas than their counterparts in Mississippi.
Conclusions
Gas prices have been nothing if not volatile in the U.S. for over the past decade, dropping to an average of less than $1.60 during the 2008–2009 recession, spiking up to $4.00 in mid-2011, hovering around $3.50 until 2014, and then tumbling down to around $1.75 just before 2016, according to data on GasBuddy. While prices are currently on the rise, with a national average about $2.82, we are nowhere near as high we’ve been at other moments over the course of the past decade. And with the average U.S. fuel economy rising to an astonishing 24.7 MPG, motorists may simply be less concerned about the fluctuations of fuel prices, which is good news for consumers, as well as the environment.
We hope you’ve enjoyed these gas price-related nuggets of information. Perhaps they’ll come in handy the next time you’re standing around in a room with your hands in your pockets and your gaze riveted to the floor, desperate to crack open a little small talk. Have fun!


Recent Comments