
Rows and Columns and Grids, Oh My! (Spreadsheets Part 1)
The spreadsheet represents a specific approach to mathematical thinking that’s been around for almost forever.
Where Columns and Rows Meet
In the SSCS Blog we’ve described how counting with fingers and toes developed over time into counting with assistants, like calculating machines and eventually, computerization.
One of the things we didn’t cover in that three-part series was a specific kind of calculation that is dependent on the arrangement of data on a grid, where the positioning of numbers and their relationships to each other—especially where columns and rows meet—are integral to determining a result.
This is the fundamental design of the spreadsheet, a term coined as early as 1906[1]. Spreadsheets today are as good as synonymous with software. However, the need to organize mathematical thinking across x- and y-axes was around long before the Digital Age.
Meaningful Relationships
From ancient times merchants, bookkeepers, and agriculturists knew that single numbers floating around in space had limited use and that additional context could make them more meaningful. Knowing total sales was useful. But what if you wanted sales by product? Or by month? Or by location? These relationships encouraged being plotted across horizontal rows and vertical columns.
Put months across the top and expenses down the side, and the page showed how costs changed over time. Put products across the top and locations down the side, and the position of a number became almost as important as the number itself. History is full of examples of the need for organizing mathematical thinking in this specific way. Let’s look at some.
Astronomical Tables
Ancient and medieval astronomers arranged dates, times, and celestial measurements in tables to predict the positions of planets, the moon, and stars. Instead of starting every calculation from scratch, a reader found one value, cross referenced it with another, and used the table’s result.
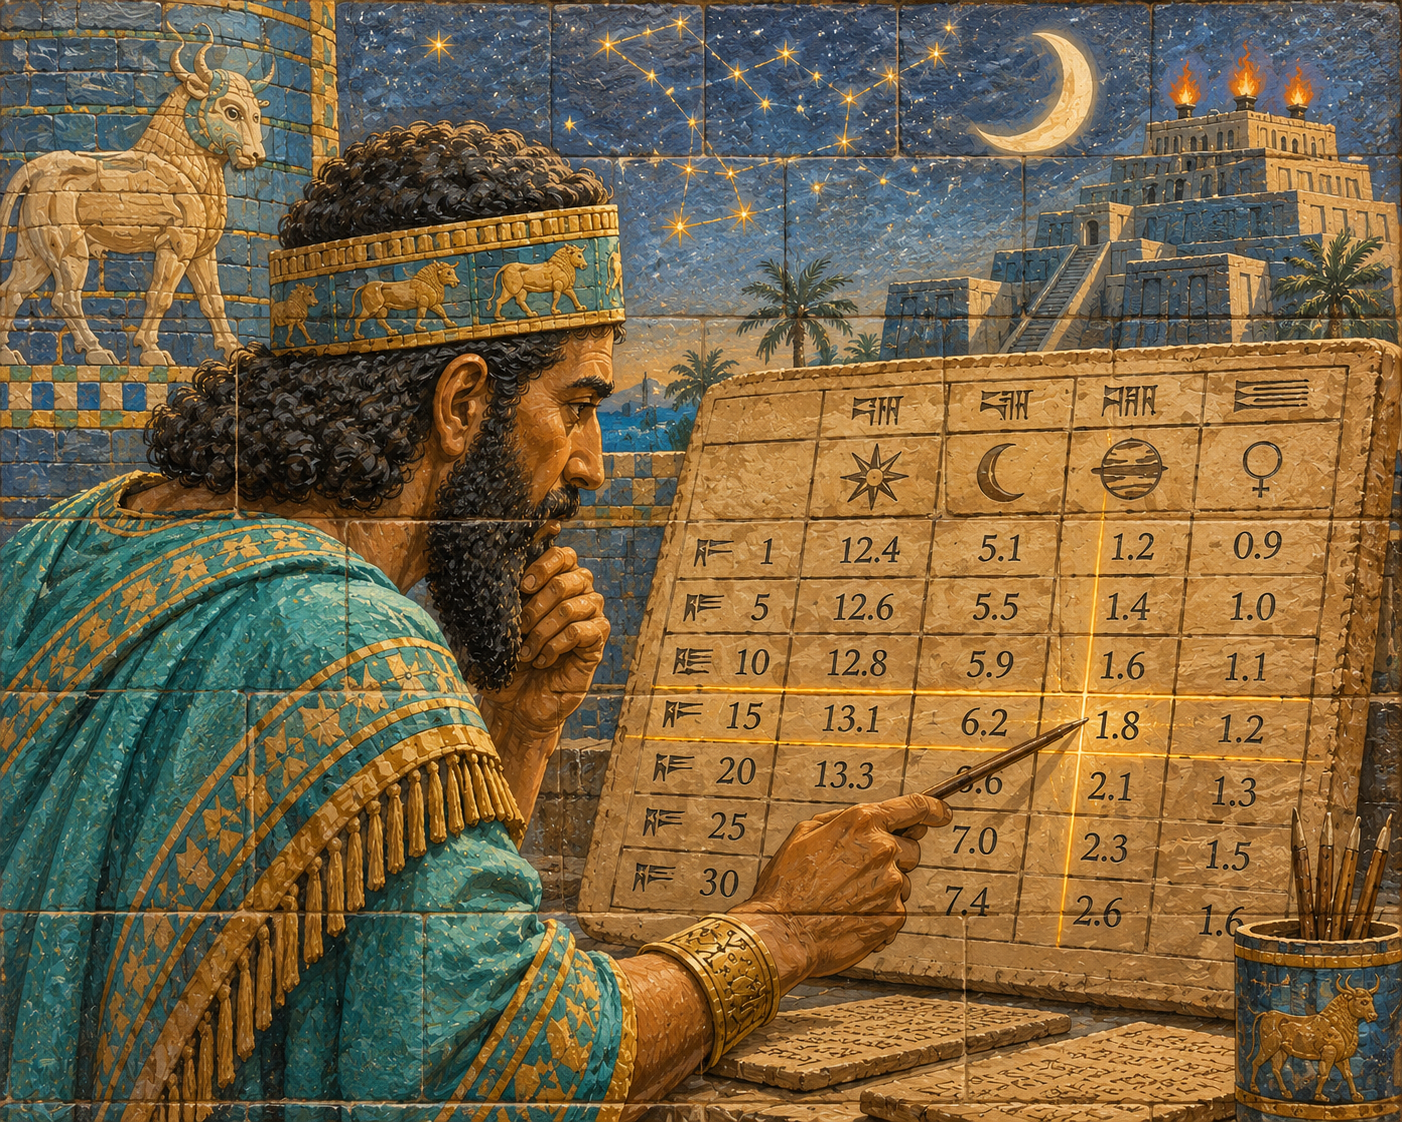
1 Babylonian Astronomer
Navigation Tables
For centuries, sailors carried books packed with numerical tables. The Nautical Almanac, first published in 1766[2], tabulated astronomical information that helped navigators determine longitude. A mariner took an observation, found the appropriate time and celestial data, and worked through the numbers—navigating oceans with rows and columns of numbers related to each other.
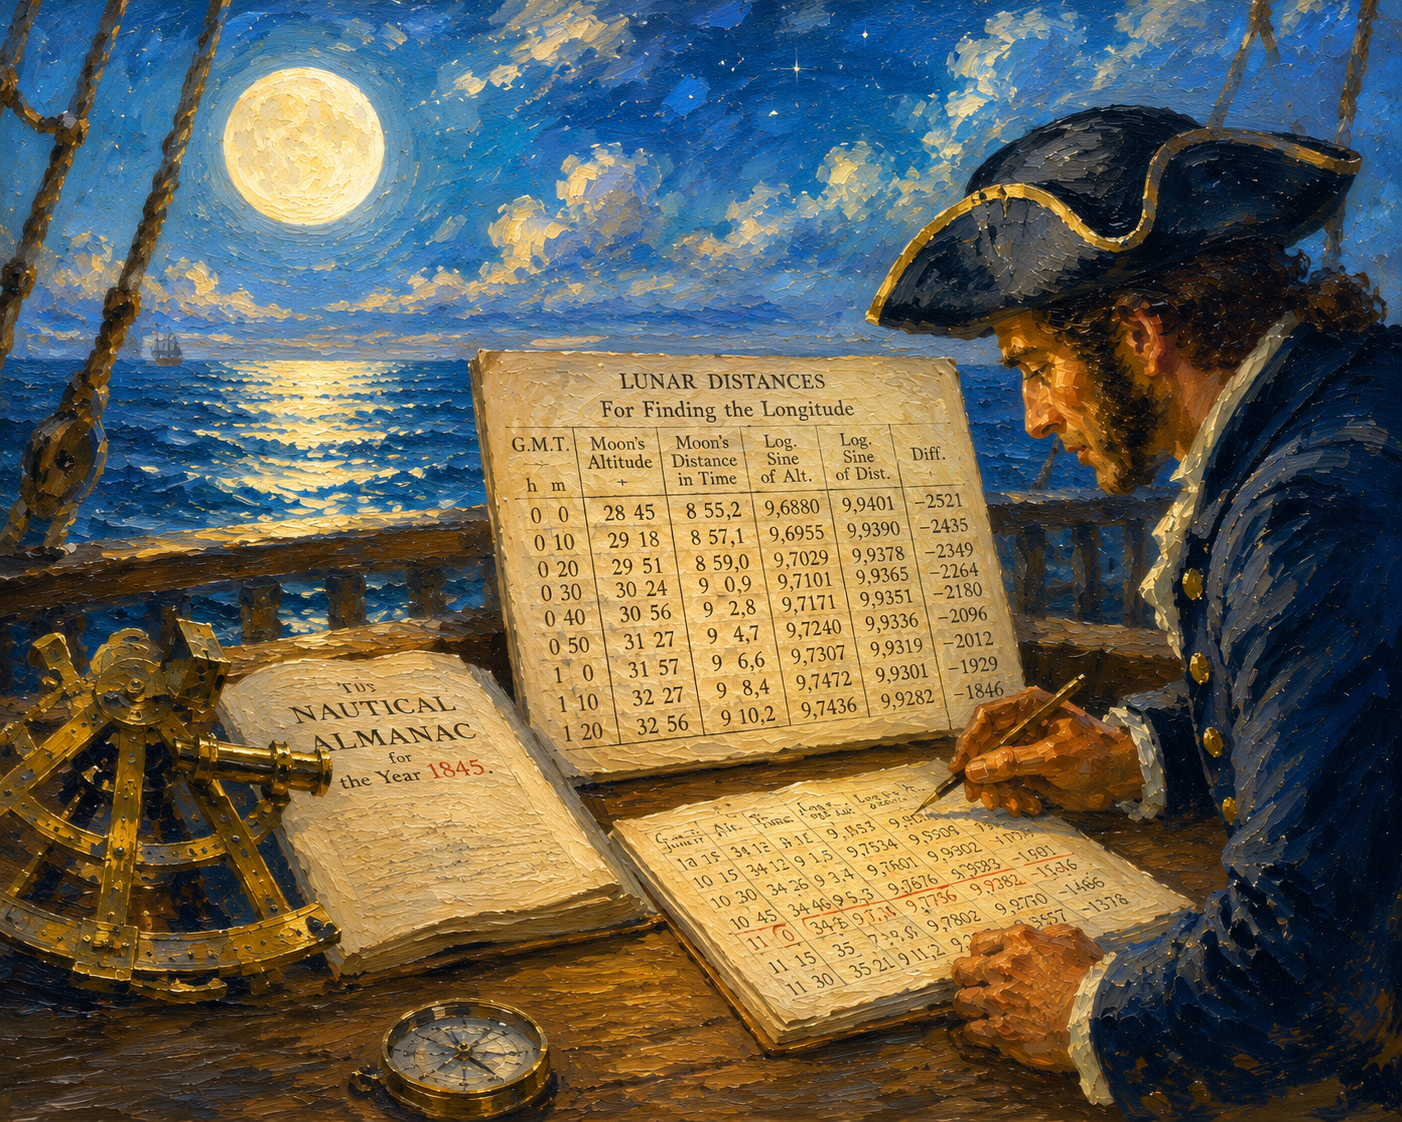
2 Nautical Navigation, 1845
The Accountant’s Ledger
Accountants made the grid a business tool. Transactions or invoices ran down the page; expense categories and other classifications stretched across it. The number at each intersection acquired meaning from its position.
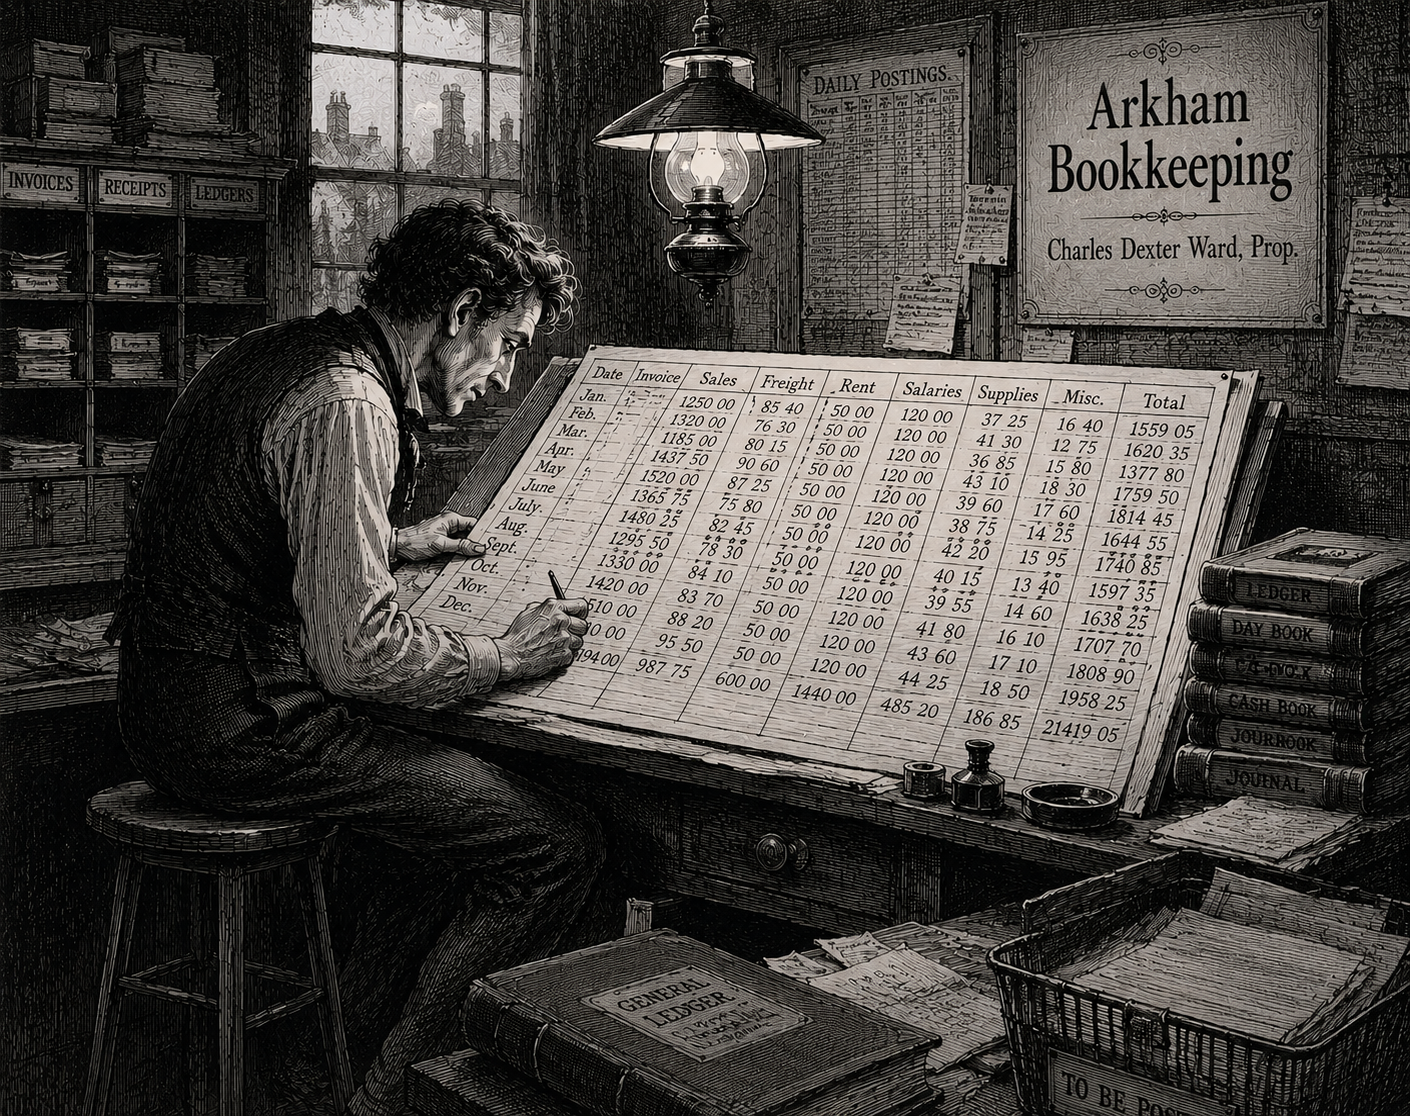
3 Clerk in a Counting House, Victorian England
Railway Timetables
The advent of the railroad as an American transportation power house gave the general public a reason to think in grids. Stations ran down one side of a timetable and trains or times across the other. Find your station, trace the row, and the intersection told you when a train arrived. A complicated transportation network had been compressed into boxes on paper.
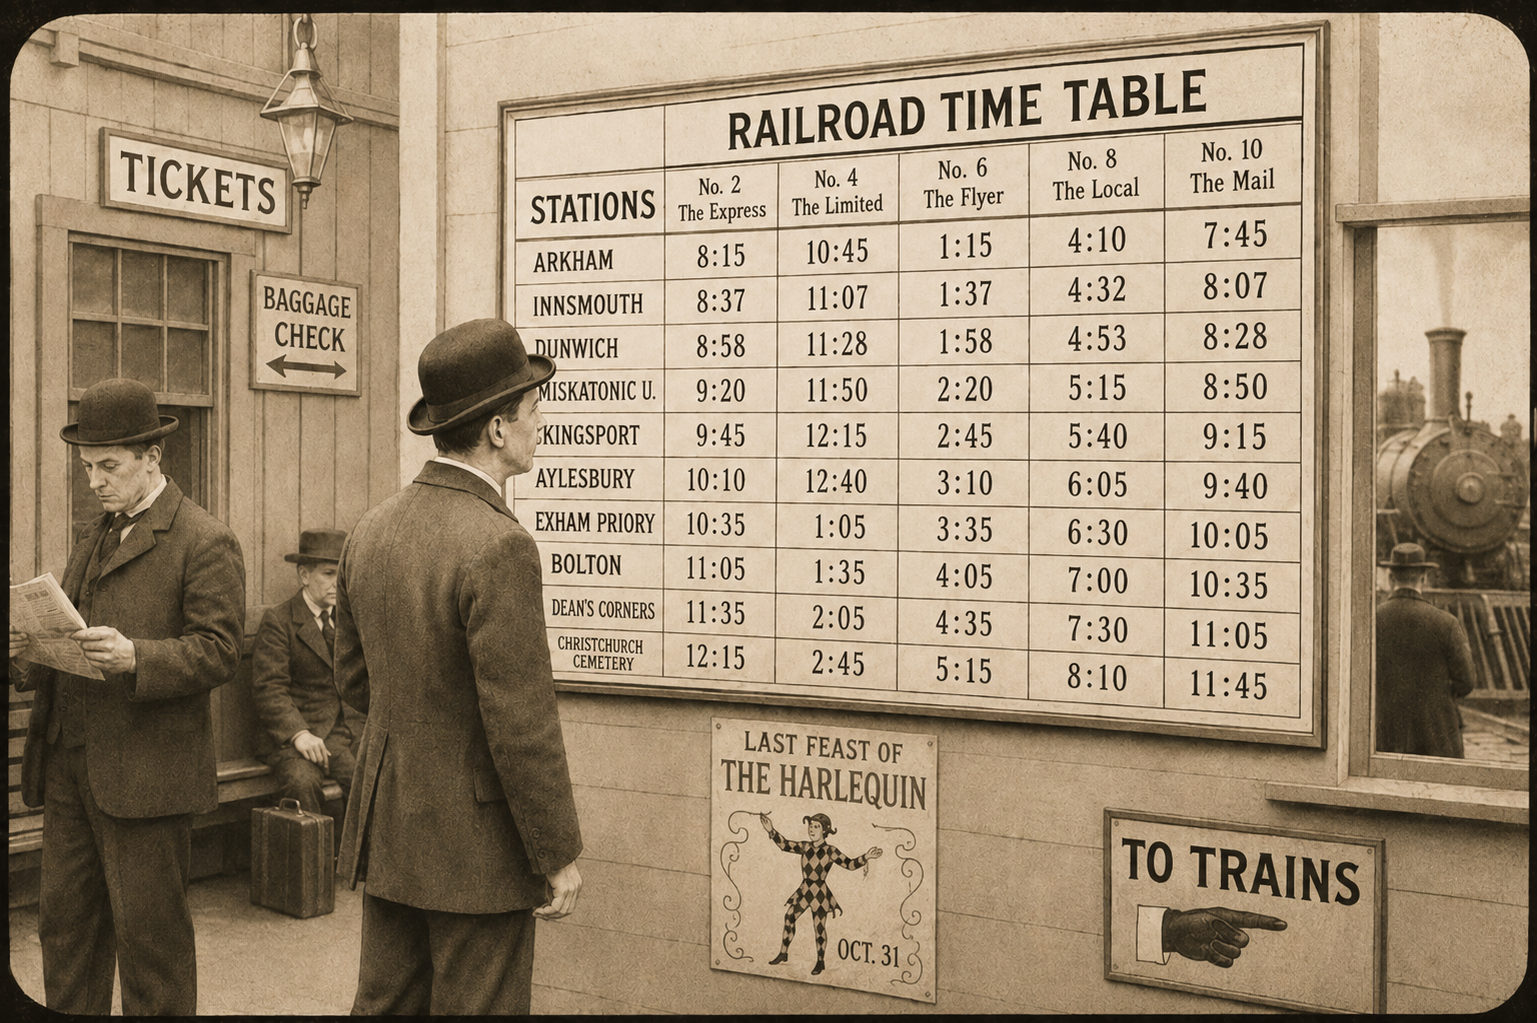
4 New England Train Station, Late 1920s
“The Magic Blackboard”
Of course, the spreadsheets we’ve covered so far have all depended on the efforts of the human being that is using the grid. Change one number and every total depending on it might have to be recalculated. Change a sales forecast, and an accountant could spend hours following that number across the sheet, erasing figures and reworking totals.
If only there were some way to get the cells calculating themselves!
In the late 1970s, that’s exactly what happened, when Harvard Business School student Dan Bricklin began to put some serious thought into financial models arranged around grids. He began to imagine what he later described as a kind of electronic or “magic” blackboard with rows and columns that could remember the calculations behind the numbers[3].
Working with Bob Frankston, he came up with a solution. But we’re out of time, so we’ll have to wait until Part 2 to find out what it was. See you then!
[1] Dan Bricklin, “The History of VisiCalc,” www.bricklin.com, accessed July 15, 2026.
[2] U.S. Naval Observatory, “History of The Nautical Almanac,” Astronomical Applications Department, first published in 1766, with data for 1767.
[3] “Spreadsheet”; Wikipedia entry.





Leave A Comment