
Gas Prices Around the World

What we found was more than a little interesting
Depending on where you live, you end up paying dramatically different prices for gasoline. We all know GasBuddy does a great job of keeping the consumer apprised up-to-the-minute on domestic prices, but what‘s it like in the rest of the world? Given the focus of SSCS (and this blog) on all subjects related to the retail petroleum industry, we decided to do a little digging. What we found was interesting, to say the least—as interesting as the following Thai gas station.

A gas station on the road from the Thai border to Siem Reap, Cambodia. (Wikipedia Commons)
For example, Venezuelans, who enjoy the cheapest fuel prices on the planet due to state subsidized petroleum, pay a little less than $0.04 a gallon at the pumping station. On the other end of the spectrum, Icelanders, whose remote country boasts a particularly strong public transportation network, pay a little more than $8.10 a gallon.
Many factors affect gas prices, from shipping costs, to taxes and regulatory fees, to trade relationships, to vehicle ownership rates and average miles driven per year. And high fuel costs affect motorists differently according to per capita incomes in their respective countries. Those Icelanders paying $8.10 per gallon at the filling station, also enjoy one of the highest per-capita annual incomes on the planet, $52,100 per citizen. Moroccans, however, who pay the global average price of about $4.40 per gallon, have a per-capita income of $8,600, making their $50-$70 fill up a much more substantial expense than a country like Canada, which pays about same price for fuel but enjoys a per-capita income of $48,100.
Let’s look at a sample range of such prices.
Global Gas Prices: A Sample Range
| Country | Price Per Liter | Price Per Gallon | Compact Fill Up (12 Gal) | Large Fill Up (16 Gal) | 2017 Per Capita GDP | Monthly Income | Compact Fill Up/Monthly Income | Large Fill Up/Monthly Income |
|---|---|---|---|---|---|---|---|---|
| Venezuela | $0.01 | $0.038 | $0.454 | $0.606 | $12,400 | $1,033 | 0.04% | 0.06% |
| Russia | $0.71 | $2.688 | $32.252 | $43.002 | $27,900 | $2,325 | 1.39% | 1.85% |
| USA | $0.76 | $2.877 | $34.523 | $46.031 | $59,500 | $4.958 | 0.70% | 0.93% |
| Australia | $1.03 | $3.899 | $46.788 | $62.384 | $49,900 | $4,158 | 1.13% | 1.50% |
| Malawi | $1.14 | $4.315 | $51.784 | $69.046 | $1,200 | $100 | 51.78% | 69.05% |
| China | $1.14 | $4.315 | $51.784 | $69.046 | $16,600 | $1383 | 3.74% | 4.99% |
| World Average | $1.15 | $4.353 | $52.239 | $69.652 | $23,437 | $1953 | 2.67% | 3.57% |
| Brazil | $1.26 | $4.770 | $57.235 | $76.314 | $15,500 | $1292 | 4.43% | 5.91% |
| UK | $1.69 | $6.397 | $76.768 | $102.358 | $43,600 | $3,633 | 2.11% | 2.82% |
| Greece | $1.92 | $7.268 | $87.216 | $116.288 | $27,800 | $2316 | 3.76% | 5.02% |
| Iceland | $2.14 | $8.101 | $97.209 | $129.613 | $52,100 | $4,342 | 2.24% | 2.99% |
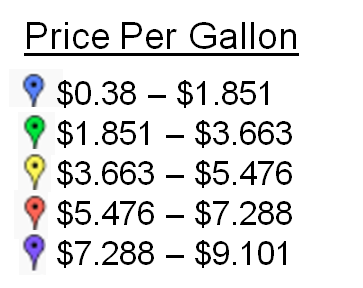 While the factors that shape global fuel prices are complicated, and some regions of the globe are simply far less dependent on automobiles than others, it’s still interesting to take a look at the international cost of driving. The map below shows statistics for all countries for which data was available (grab it and move it around if you can’t see the part of the world you want to reference), and the key to the right explains the map’s color scheme.
While most of us don’t have to be concerned with the pain at the pump experienced by Moroccan and Icelandic vehicle owners, this kind of global survey gives U.S. drivers some useful perspective on how the global economy impacts what you pay for fuel. How these dynamics will play out in the future is anyone’s guess.
Please note: The statistics on gas prices in this post come from: https://www.globalpetrolprices.com/gasoline_prices/. Statistics on global per-capita incomes come from: https://www.cia.gov/library/publications/the-world-factbook/rankorder/2004rank.html.


Recent Comments